Both Time Domain and Frequency Domain test procedures provide the best overall signal analysis with the assumption that the necessary instrumentation is used and configured correctly. Although both methods should be familiar to any seasoned electrical engineer many in the consumer electronics industry are unaware of their names and the unique capabilities they offer. When working in any detailed signal analysis integrity is paramount and the only way to know that your signals have the integrity for their designed purpose is by using and understanding these two forms of signal test analysis. All signals operate in both Time and Frequency Domains. The differences in these test applications are pretty much explained by their names, Time and Frequency.
Time Domain
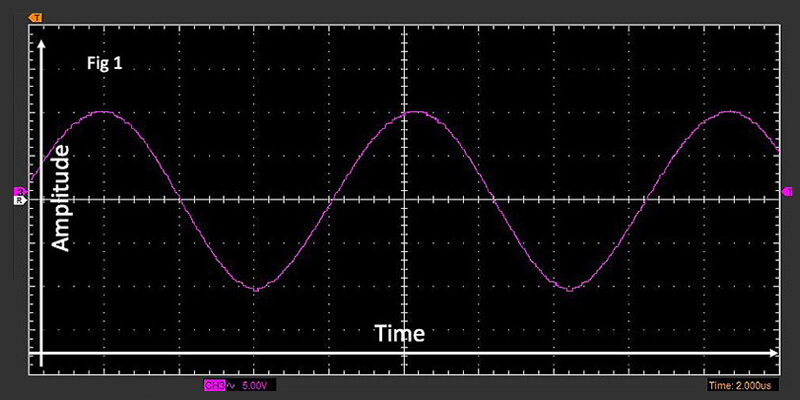
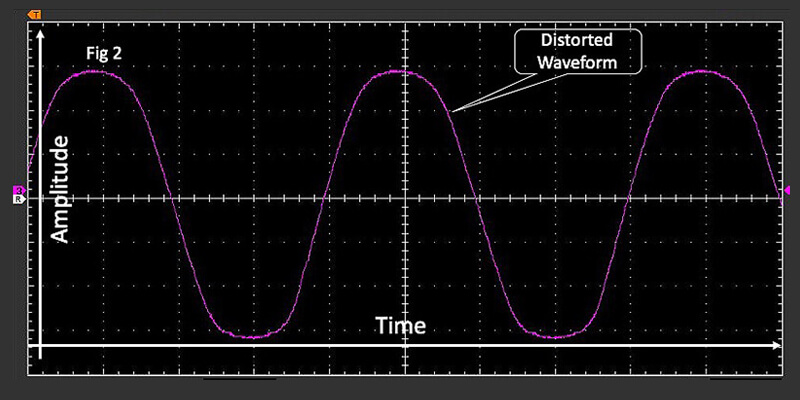
Time Domain is the study of signal content with respect to time. More understood when using an oscilloscope, Time Domain functions can provide a detailed analysis of any signal’s output modulation. Measured over time it becomes a tool to measure waveforms within a time boundary of the past and future. Fig 1 demonstrates an oscilloscope operating at 1KHz displaying both amplitude and time. The oscilloscope provides a perfect picture of signal integrity and output level. Fig 2 shows the same signal with less integrity compared to Fig 1. Here distortion is easily recognized and can be dealt with. Since these types of waveforms are seldom stable, Time Domain allows a weighting process to stabilize the waveform image for more accurate measurements
Frequency Domain
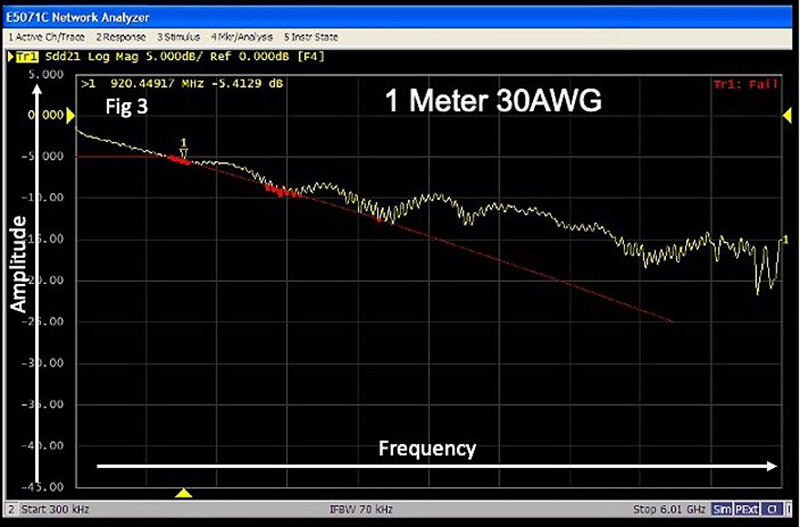
Frequency Domain depicts a signal in terms of sinusoids providing a straightforward way for analyzing bandwidths and how signals behave when being transmitted. Frequency Domain allows a user to analyze a signal’s characteristic makeup and magnitude. They are not local in time but instead spread over an interval. It can also be used to determine response curves such as insertion and spectral analysis and more. Fig 3 depicts an example of an insertion loss curve of a high-frequency transmission line. This instrument is set up with a start frequency of 300KHz and stops at 6GHz. Here you can clearly see the losses due to the cable’s length and quality, but no detail on the shape or distortions of the signal being transmitted as we saw in the Time Domain images above.
The Need For both Frequency and Time Domain Tests Analysis

This goes to show that both Time and Frequency Domain testing is required to perform the best overall analysis of any signal. Fig 4 is an oscilloscope trace showing a square wave response. It is made up of several other frequencies all at the same time. Fig 5 superimposes these frequencies in blue.
Notice there are both higher and lower frequencies that make up this square wave. However, in Fig 6 we take it from both Time and Frequency viewpoints demonstrating the yield each test function offers. It shows an expanded view of all the frequencies that make up the one square wave.


The left side scope image shows the original square wave being analyzed. The 3-dimensional spectral response provides a better view of each frequency within the square wave. The right-side scope trace demonstrates the frequency component for each frequency with a vertical mark showing frequency and amplitude. Here we can see exactly where each signal lives within this particular spectrum using the frequency and amplitude value of each sub-frequency.
In the real physical world signals are not made in perfect order. This video will demonstrate how Time and Frequency Domains have a direct influence from a signal derived from a laboratory signal generator. The frequency is 263Hz, about middle C on the piano.
The left Time waveform is what you would see in Time Domain and the right Frequency waveform is what you would see in Frequency Domain. The signal is 10 seconds long. Play the video and you can clearly see and hear that the fundamental 263Hz is made up of other harmonics and overtones deviated plus and minus from the center frequency.
This video is the same overall test however in this case we are using a real piano striking middle C on the piano. Notice in this case that the sound is made up of many harmonics and overtones, far more than our 1 263Hz signal.
Testing High-Frequency Signals
We have demonstrated why both Time and Frequency Domain test analyses are the best and most complete forms of signal testing. Now let’s take it to another level with frequencies in the microwave region and how these Eye Diagram stories grow in detail allowing great detail with all Eye Diagram Functions offering necessary attention for all electrical engineers a high level of analysis.

Figure 7
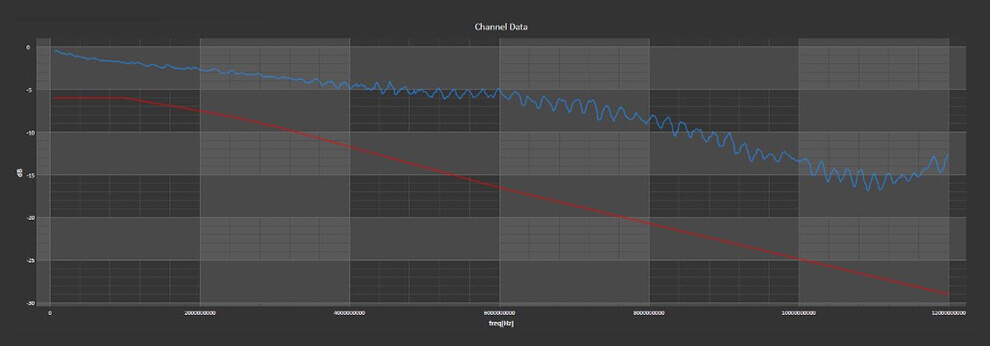
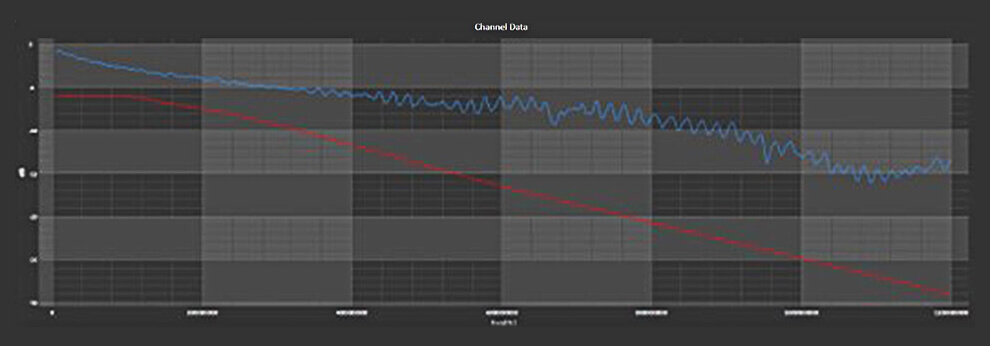
Fig 7 and 8 demonstrate two Eye Diagrams from two different cables at 12GHz. Fig 7 demonstrates a near-perfect Eye Diagram with perfect symmetry and distortion. Its Frequency Domain response curve has a smooth roll-off and output. However, in Fig 8 the Eye Pattern shows signs of distortion, noise, jitter, and ISI (Inner Symbol Interference). Yet its Frequency Domain response still has a reasonable outcome. This just goes to prove that unless the test both Time and Frequency Domain Testing these anomalies would never be discovered.

Figure 8
Conclusion
We have demonstrated why both Time and Frequency Domain test analyses are the best and most complete forms of signal testing. Now let’s take it to another level with frequencies in the microwave region and how these Eye Diagram stories grow in detail allowing great detail with all Eye Diagram Functions offering necessary attention for all electrical engineers a high level of analysis.
When testing any High-Speed video signal both Time and Frequency Domain test analysis provides the most comprehensive way to measure and judge high-frequency video modulations for both integrity and reliability. It also provides a perfect monitor for these tests but also allows its operator to read each waveform’s qualities while being passed through any form of the median. It’s these measurements that decide the overall health of each cable product.
