What Makes DPL Labs® 48G Reference Standard The Superior Digital Video Testing Standard?
48G Digital Video has made substantial improvements beyond all other past consumer digital video formats. This includes increased picture resolutions to 8 and 10K, Dynamic HDR, Source-Based Tone Mapping, and eARC (Enhance Audio Return Channel) to name just a few. But this all comes at a cost by consuming the largest data rate and traffic to date. With close to 50Gbps data rates cable interface devices must exceed past requirements by more than double. These new requirements will challenge the performance of any cable device attempting to reproduce these bandwidth dynamics never before realized.


To verify these mandatory high data rates an entire top-down rebuilding process was put into play by DPL Labs® starting with test instrumentation, new selective High-Speed testing processes, faster processing speeds, intellectual property-protected Certification Seals, and people with a passionate goal for excellence both within the technology and with each client.
Both Frequency and Time Domain test methodologies are utilized producing more than 75 discrete tests conducted for each DUT (Device Under Test0) that enters into DPL Labs® 48G Reference Standard test program. With that many test measurements, time becomes critical. Whether operating in the Frequency or Time Domain areas each test assignment takes time, some longer than others. DPL Labs drive to reduce testing costs required new ideas, specialized instrumentation, and software contributing to accelerating test functions at light speeds by way of a new custom-design user interface software for computer automation. This inadvertently reduces costs substantially and still maintains test accuracy throughout the process. This means more quality time to decipher each test performance. Whether it Passes or Fails it allows skilled operators more time for a high level of scrutinization and focus on all 75 plus tests. This then gets tabulated within the DPL Labs® Argumentative Matrix allowing DPL Labs clients a wealth of data for analysis at their discretion. DPL Labs® uses this data to construct a representation of the product’s overall health and well-being. This is presented to each client in a form that is not complicated to understand yet allows for total transparency of the performance of each product. It is here where DPL Labs raises above all other testing laboratories by pushing the envelope of technology and know-how while still providing a lifeline for excellence. We have over 15 years of experience and we’re good at it!
Test Instrumentation
No longer can one rely on off-the-shelf generic test instrumentation typically utilized for this kind of digital test analysis that essentially trapped most testing labs into instruments nonspecific to a particular application with limitations in functions and speed. When faced with extreme bandwidths every detail must be analyzed and assimilated into its designed service envelope. Every single bit of data passing through a conductive median must have a direct conduit to its adjoining hardware. Tainted data and complex instructions at light-speed data rates are recipes for disaster.
DPL Labs® chose instrumentation that could be completely customizable for both speed and accuracy. It needed to accept a high level of customized instructions to escape from traditional testing processes launching it to a new level of testing methodologies never before used or experienced within traditional testing labs. Tests that are made are given tough customized minimums and targets more directed to the goal for:
Maximum Performance and Minimal Risks.
This is the way.
Argumentative Matrix Testing Processes
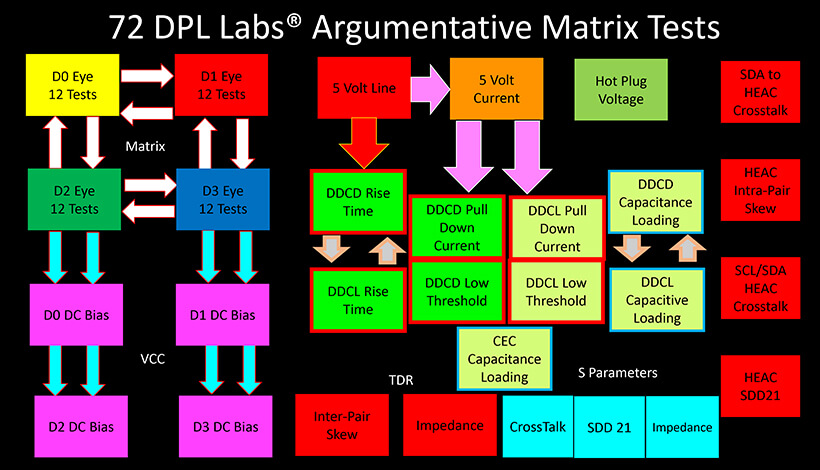
These new test instrumentation systems allow for a wide assortment of testing values in a comparative analysis algorithm known as DPL Labs® Argumentative Matrix (Fig 1). It allows for measured values to enter a process that treats each test for its intended contribution to the interface. It took years to build the process and now it only takes seconds to execute. Each value is a pre-determined limit from DPL Labs® case studies that can match these dynamic limits to other tested values also contributing to the same goal. Although it is pass/fail process it yields constructive data that every client owns and can improve their products at their discretion. DPL Labs® Argumentative Matrix is a one-of-a-kind process and is proudly owned by DPL Labs®.
Some Frequency and Time Domain Tests Analysis
Eye Pattern Tests
A popular measurement in Time Domain, the eye diagram, is created when a digital signal is repetitively sampled and applied to the vertical input of an oscilloscope while the data rate is triggered for the horizontal sweep. Eye diagrams consist of two horizontal lines with the instantaneous rise and fall times from a signal source. Superimposing enough of these repeatedly develops into a dark area where the horizontal lines will appear. A succession of ones and zeros, a period of regular or irregular sequences, a quasi-random series of ones and zeros, or any combination produces these accurate images. Provide enough of these signals an Eye Diagram will reveal the overall health of the signal data to an operator skilled in the art of eye diagnostics. An engineer specializing in the art of reading Eye Patterns can interpret a story, or a health checkup, providing a huge amount of data to help shape and utilize these measurements to the finest of detail. Fig 2 and 3 depict each measurement point used in an Eye Diagram.
The Anatomy of an Eye Diagram
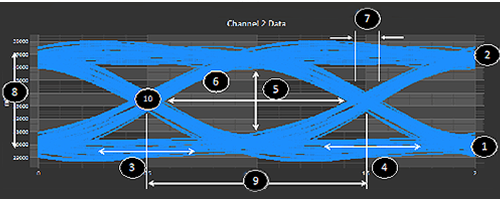
Figure 2
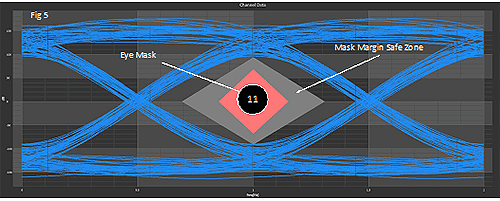
Figure 3
Eye Legend
- Zero Level – A measurement of the mean value of the logical 0 of an Eye.
- One Level – A measurement of the mean value of a logical 1 of an Eye.
- Rise Time – A measurement depicting the transition time of data’s Upward Slope.
- Fall Time – A measurement depicting the transition time of data’s Downward Slope.
- Eye Height – Determined as Eye Height = (one level – 3Ó) –– (zero level + 3Ó).
- Eye Width – A measurement of the horizontal opening of the eye.
- Jitter – The transition deviation from ideal time caused by reflection relative to other transitions.
- Eye Amplitude – The difference between logic 1 and 0 in the amplitude Crossing point.
- Bit Period – The Horizontal Measurement of the Eye.
- Crossing – The percentage of symmetry as the signal energy crosses over.
- Eye Mask – These are a series of limit lines that judge the minimum and maximum limits. These can be found as lines, or any form of polygon depending on what is determined as the limits. DPL Labs® developed the specification for the mask (flat blue hexagon at the center of the screen) to indicate the minimum DPL performance standard. If any trace touches the mask, the product’s performance fails. DPL tests and measures the percentage of headroom above the mask margin.
More headroom means better performance. In the images shown here, the first example is virtually a perfect eye. Take note of the symmetry of the eye image as well as the significant amount of space over the mask.
Additional Time and Frequency Domain Tests Analysis
Although DPL Labs® does put a fair amount of weight on Eye Pattern measurements there are still other critical tests outside of the Time Domain resulting in further data points that make up the DPL Labs® Augumentive Matrix. In particular, is:
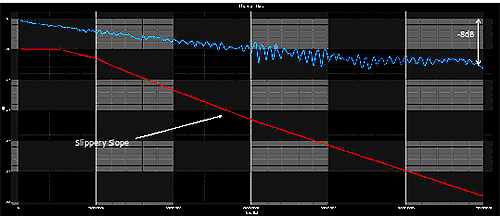
Figure 4
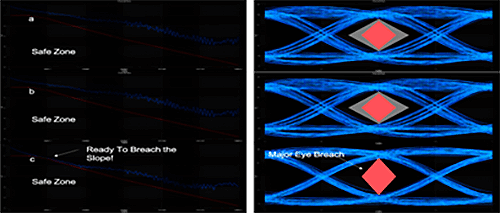
Figure 5
SD21 Insertion Loss (Frequency Domain)
SD21 (Fig 4) describes how well any transmission line performs over a particular range of frequencies. This illustration demonstrates one such response with limit lines DPL Labs® refers to as the “Slippery Slope”. The flatter the response the better the performance. The red Slippery Slope is the limit mask used to judge if a device passes or fails. However, this only shows its signal response and not its signal integrity. These response curves can respond differently depending on cable topology, metallurgy, gauge, and length. Figure 4 demonstrates how SD21 measurements can show how a cable device can vary in response. But this is only good on the analog side of the equation and does not provide the additional details required for measuring these types of digital transmissions. Fig 5 also demonstrates how SD21 and Eye Diagrams react a form of harmony with one another. Notice in sample C how the SD21 curve just breaches the Slippery Slope and the effect it has on its corresponding Eye Diagram. As mentioned earlier, these Eye Diagrams are vertical analog measurements. The more separation from the mask (Gray Diamond) is from the Eye Diagram itself the better the performance and reliability.
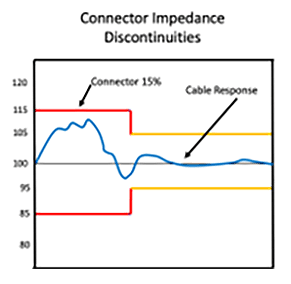
Figure 6
Impedance Profile
At microwave levels impedance becomes a major part of the integrity of the interface. If the characteristic impedance of the transmission line ever moves out of range from the system’s source impedance, differences in all the previous measurements can be realized. To test this function, another controlled mask is introduced (Limit Lines) to confirm that the overall impedance of the DUT (device under test) will meet the published requirements. Figure 6 demonstrates what an impedance curve can look like under test. Notice that the mask has much more vertical room in Red compared to the smaller Yellow as it moves from left to right. The reason for this is due to the cable’s connectors. The connection on either end of a device will always produce impedance discontinuities. This area is always suspect as each cable device is tested. The tighter these curves stay under the Yellow Limit Lines (+-10% of the impedance) the less chance there is for reflections to occur, which in most cases causes ISI (Inner Symbol Interference). A skilled operator can define these limits to Eye Diagram anomalies that become visible when read.
Crosstalk
Crosstalk is the amount of signal leakage that takes place from one channel to another. This has to be measured throughout the entire frequency envelope and must meet certain minimums to keep high-speed data protected from one channel to the other. If data from one channel contaminates another will cause the interface to misinterpret the data being transmitted, causing the system to fail. This is a huge concern for reliability and motion artifacts. Fig7 demonstrates how these measurements are made.
The waveform starts at 0 Hz and ends at 12GHz. The red limit lines are used to flag the operator when the DUT has failed. Due to 48G’s wide operating envelope, different levels of crosstalk per frequency can be focused on and utilized. Here at 4GHz, the crosstalk extends close to breach levels with clear margins at 10GHz but back up at close to 12GHz. 48G Digital Video brought even more challenges by adding an extra video channel from 3 to 4 channels. This makes these requirements a bit more challenging.
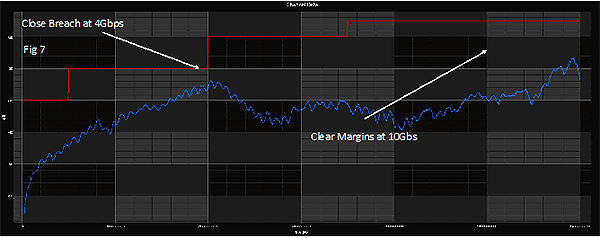
Figure 7
These crosstalk measurements can also be utilized to examine Radiated Emissions, another mandated certification to the interface. Many believe that radiated emissions can only affect outside electronic devices but in reality, they can also radiate within each DUT and this can be challenged further by twisting and turning the device. Close observation of these waveforms can provide early discovery of such emissions being generated.
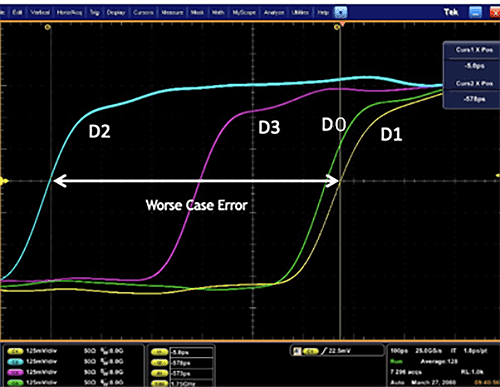
Figure 8
Inter-Pair Skew
These tests are designed to measure how much of a difference there is between the timing of each high-speed digital channel portrayed in Figure 8. The faster the data is carried through any median the more critical these values become. Timing is everything in digital video when it comes to synchronization. The greater the time errors the more susceptible the interface gets and can lose synchronization from one channel to another. Again, in the 48 Gbps release, there are now four channels to be concerned about compared to just three used in previous versions. When using a twisted differential pair wire arrangement, a bend or kink in a cable can have a direct relationship to the accuracy of the timing. These lanes must be held to very close time tolerances to achieve Maximum Performance and Minimum Risks. The longer the cable gets the easier timing errors can occur.
DDC Channel Integrity Testing
This channel of the interface is relatively small in bandwidth compared to other signal channels clocking in at only 100KHz. However, it can be as important as any High-Speed Video signal. Historically the DDC channel has been the most problematic channel within the entire interface. DDC is considered by many to be a “sleeper” when it comes to interoperability issues.
DDC is a two-channel information channel. It shares data between both the source (Set-Top Box, DVD, etc.) and the sink (Display or any input stage). It uses a half-duplex serial protocol and was designed by Philips Semiconductor in 1982 called Inter-Integrated Circuit or I²C for short. It serves as a serial communication bus between integrated circuits (IC) on printed circuit boards. Typically, these ICs are seldom more than a few inches apart. However, in digital video I²C communications over cable can be as short as .5 Meters and long as 100 Meters, far beyond its original intent. This is where the trouble begins.
Philips wrote a clear specification on the I²C interface. One of the most important specified limits to its operation is the integrity of its waveforms. The illustration below demonstrates what an I²C waveform looks like in real life. Not anything special, just a bunch of square waves made up of 0’s and 1’s. Each square wave represents 1 bit of data. Any waveform can be high or low depending on how the I²C code is written. A clock is used to locate and identify the binary level of each bit by moving through a series of waveforms from left to right and identifies a high or low level by the high point of each clock pulse. Starting from the left, in this example, the first data bit is identified as a 1. The next two data bits are 0’s, the next is a 1, and so on. Fig 10 demonstrates just one of these data bits blown up in a perfect world depicting a perfect square wave. The amplitude of the square wave is 5 volts, taken from the Philips specification. Certain rules must be followed for the system to function. Referring now to Fig 11 shows what the waveform looks like under typical conditions in real life. Here, instead of getting a perfect square wave, it looks more like a slow rise of the wave starting at the initial bit transition of 0 volts and ending at its peak of 5 volts.
It should be noted that the 5 Volts used by I²C is derived from the 5-volt supply line found on the Digital Video bus. Therefore, this voltage must remain as close to 5 volts as possible. Anything lower than 4.7 volts its integrity is jeopardized.
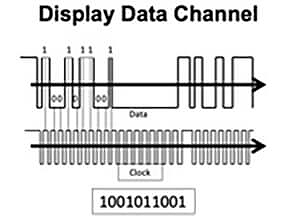
Figure 9
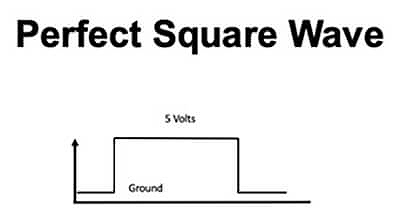
Figure 10
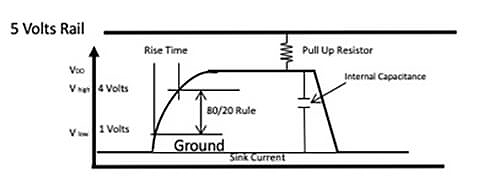
Figure 11
Fig 11 defines the entire I²C waveform limits in voltages and rise time, the time it takes to start and end a transition using the 80%/20% rule. Here logic level 1 is received when the transition gets to 4 volts and a logic level 0 is read at 1 volt. The time it takes to get from 1 to 4 volts is the I²C Rise Time. This Rise Time is clearly defined in the Philips I²C specification with a max time of 1000ns (1µs). The reason for the delay is due to a level of capacitance within the I2C wires and PCB.
Both Data and Clock wires are buried inside a shield which establishes the reference ground for the entire interface. Since these wires are near the shield a certain amount of internal capacitance is always found. This capacitance increases as the cable gets longer. This is not such an issue at the PCB level but when it starts to appear on cables it becomes a serious issue as cables get longer. Philips specification for the capacitance is no more than 400pf (Pico Farads). However, the limits for Digital Video call this out at 700pf providing a bit more consideration for cables. Interpolating the Digital Video capacitive loading limit to the Philips numbers the updated Rise Time would increase to approximately 1800ns or 1.8µs.
Fig 12 demonstrates how these capacitances increase over cable length. By the time we reach 9 meters the Rise Time already breaches Philips specification numbers. These values can vary up or down depending on the quality of the cable and wire gauge. This example demonstrates a robust signal using a larger wire gauge of 24 AWG. The larger the gauge the better the response, the higher costs, increased cable weight and size, and the lack of suppleness.
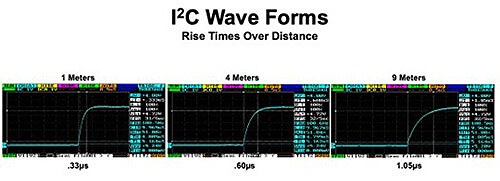
Figure 12
Still, there is more that must be considered in this I²C soup of variables. If we were to assume that all cable products are manufactured this way all would be good, but unfortunately, they are not. Many don’t make the numbers after the first manufacturing spin while others do. After each new spin, the odds are high that these performance numbers will decrease due to the original overseas manufacturer trying to increase profit by building them with less expensive materials. DPL Labs® catches this all the time sending out alerts to each participant when their cables are scheduled for retesting after each new production run. It is a service that DPL Labs® provides for its participants and affiliates. If any samples are identified as not making DPL Labs® minimums the cable firm gets the call. The same thing is true even during a production run by randomly buying the cables that are in the field and producing the same verification.
But all is not lost here. DPL Labs® sees these types of product issues come in for testing all the time with a high degree of failures, particularly in this one area. As a testing lab, DPL Labs® provides additional support to its participants and affiliates helping them get their products back on track in holding their performance requirements. We offer solutions to issues like this with historically proven designs provided they are executed correctly by their manufacturer.
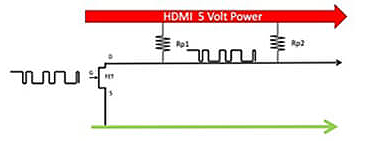
Figure 13
For example, there are circuit designs that can provide additional support to the I2C bus should the rise time numbers get too high. Fig 13 depicts how the I²C transmission is made. Signal data is driven through the gate of an FET (Field Effect Transistor). When the FET is turned off it becomes an open circuit, and no signal appears. However, by adding in termination resistors and connecting them to the 5-volt supply line a logic 1 signal is created by applying a pull-up voltage through a resistor to 5-volts (Vcc) creating a logic 1 amplitude.
This happens throughout the bus with termination resistors Rp1 and Rp2. By adding additional FETs and pull-up resistors one can determine the amount of current being generated from 5 Volts to ground. The larger this resistor is the lower the current, the smaller the resistor the higher the current. If these currents get too high, it will reduce the 5-volt bus damaging the 80%/20% rule. Remember the specification calls for <.9 volts to establish a digital 0. Some devices like active I²C long-distance circuits and more recent source and sink devices sometimes do this one better. The specification calls for <.9 volts which means if we are lower than that we are in good shape. Well not really. There are now source, sink, and active I²C products that are typically bottoming out at .2 to .5 volts, much less than the <.9 the specification calls for. If a transmit or receiver device is looking for <.9 and not <.4 volts a digital low is not read, and we are into full failure mode again. This issue popped up a few years ago and still today there has been no mention of it except for some astute manufacturers skilled in the art of I²C. With so many devices in the field, these types of failures continue to pop up. These FETs can deliver as much as 10ma of current, much more than the spec calls out at only 3ma.
Conclusion
There is quite a bit of activity going on within each Digital Video Cable. Being focused on just the video channels does not offer any guarantee these products would have a high success rate in the field. Reliability is everything. All factors of the interface must be challenged and examined. Working with the correct Test and Measurement firm keeps new development, product verification, and product consistency under your control.
